Welcome to the Continuous Glucose Monitoring (CGM) tutorial on the JupyterHealth platform.
This notebook walks you through:
📥 Getting patient and study information from JupyterHealth Exchange
📥 Loading CGM data from JupyterHealth Exchange
🧮 Calculating core AGP (Ambulatory Glucose Profile) metrics
📊 Visualizing glucose trends for researchers or clinicians
🔗 Step 1: Connect to JupyterHealth Exchange and Explore
We use the jupyterhealth-client package to securely pull CGM data from a trusted JupyterHealth Data Exchange.
from enum import Enum

import cgmquantify
import pandas as pd
from jupyterhealth_client import Code, JupyterHealthClient

CGM = Code.BLOOD_GLUCOSE

pd.options.mode.chained_assignment = None

jh_client = JupyterHealthClient()- 🏥 First, list available organizations
JupyterHealth Exchange organizes data access and patients are associated with organizations, which may be in a hierarchy of institutions, departments, teams, etc.
# construct a dict of all organizations
org_dict = {org['id']: org for org in jh_client.list_organizations()}
# populate a tree of children, from each organization's `partOf` reference to its parent
# the root org has id=0

for org in org_dict.values():
    parent_id = org['partOf']
    if parent_id is not None:
        parent = org_dict[parent_id]
        parent.setdefault("child_ids", []).append(org['id'])
def print_org(org, indent=''):
    print(f"{indent}[{org['id']}] {org['name']}")
    for org_id in org.get('child_ids', []):
        print_org(org_dict[org_id], indent=" " * len(indent) + " ⮑")


for org_id in org_dict[0]['child_ids']:
    print_org(org_dict[org_id])
[20011] University of Example
⮑[20027] ACME
⮑[20013] Example Institute for Tutorials
⮑[20026] Cardiology Department
⮑[20024] JupyterHub users
[20001] U of X
⮑[20019] East Campus
-🧍🏾♀️📋🧍🏻♂️Second, list available studies and patients
A study is associated with an organization and specific data requests.
Practitioners have access to specific studies, e.g. via their organization membership.
All my studies:
for study in jh_client.list_studies():
    print(f"  - [{study['id']}] {study['name']} org:{study['organization']['name']}")
- [30012] CGM & Metabolic Health Study org:Example Institute for Tutorials
- [30010] Health Connect CGM Integration org:Cardiology Department
- [30013] iHealth Blood Pressure Study org:Cardiology Department
- [30006] Remote Monitoring demo org:East Campus
- [30011] Sample Data org:Example Institute for Tutorials
I’m interested in the ‘Sample Data’ study, with id 30011.
I’m interested in it because it’s the one with fake patients and sample data from cite (no label) so I can include the output in these docs.
study_id = 30011
study = jh_client.get_study(study_id)
study
{'id': 30011,
'name': 'Sample Data',
'description': 'To explore the Exchange capabilities. This study should only contain synthetic patients and already published or synthetic Observations.',
'organization': {'id': 20013,
'name': 'Example Institute for Tutorials',
'type': 'edu'}}Reviewing patients in the study
We can review which patients are in the study, and which are invited to the study but haven’t consented to data availability via the patient consents endpoint:
from dateutil.parser import parse as parse_date

# show all the patients with study data I have access to:
print(f"Patients in study [{study['id']}] {study['name']}")

for patient in jh_client.list_patients():
    consents = jh_client.get_patient_consents(patient['id'])
    consented = {
        _study['id']: _study
        for _study in consents['studies']
    }
    pending_consent = {
        _study['id']: _study
        for _study in consents['studiesPendingConsent']
    }
    if study_id not in consented and study_id not in pending_consent:
        # ignore patients not in the study
        continue
    print(f"[{patient['id']}] {patient['nameFamily']}, {patient['nameGiven']}: {patient['telecomEmail']}")
    if study_id in consented:
        study_consent = consented[study_id]
        for scope_consent in study_consent['scopeConsents']:
            date = parse_date(scope_consent['consentedTime']).date()
            print(f" - {scope_consent['code']['text']}, consented {date}")
    if study_id in pending_consent:
        study_pending_consent = pending_consent[study_id]
        for scope_consent in study_pending_consent['pendingScopeConsents']:
            print(f" - {scope_consent['code']['text']} (not consented)")
Patients in study [30011] Sample Data
[40001] Patient, Demo: demouser@jupyterhealth.org
 - Blood glucose (not consented)
 - Blood pressure (not consented)
 - Heart Rate (not consented)
[40054] Nguyen, Minh: minh.nguyen@example.com
 - Blood glucose, consented 2025-04-17
 - Blood pressure, consented 2025-04-17
 - Heart Rate, consented 2025-04-17
[40055] Smith, Olivia: olivia.smith@example.com
 - Blood glucose, consented 2025-04-17
 - Blood pressure, consented 2025-04-17
 - Heart Rate, consented 2025-04-17
[40056] Chen, Liang: liang.chen@example.com
 - Blood glucose, consented 2025-04-17
 - Blood pressure, consented 2025-04-17
 - Heart Rate, consented 2025-04-17
[40057] Patel, Anika: anika.patel@example.com
 - Blood glucose, consented 2025-04-17
 - Blood pressure, consented 2025-04-17
 - Heart Rate, consented 2025-04-17
[40058] Garcia, Carlos: carlos.garcia@example.com
 - Blood glucose, consented 2025-04-17
 - Blood pressure, consented 2025-04-17
 - Heart Rate, consented 2025-04-17
[40059] Okafor, Chinelo: chinelo.okafor@example.com
 - Blood glucose, consented 2025-04-17
 - Blood pressure, consented 2025-04-17
 - Heart Rate, consented 2025-04-17
[40060] Kowalski, Zofia: zofia.kowalski@example.com
 - Blood glucose, consented 2025-04-17
 - Blood pressure, consented 2025-04-17
 - Heart Rate, consented 2025-04-17
[40061] Tanaka, Hiroshi: hiroshi.tanaka@example.com
 - Blood glucose, consented 2025-04-17
 - Blood pressure, consented 2025-04-17
 - Heart Rate, consented 2025-04-17
[40062] Abdullah, Layla: layla.abdullah@example.com
 - Blood glucose, consented 2025-04-17
 - Blood pressure, consented 2025-04-17
 - Heart Rate, consented 2025-04-17
[40063] Dubois, Émile: émile.dubois@example.com
 - Blood glucose, consented 2025-04-17
 - Blood pressure, consented 2025-04-17
 - Heart Rate, consented 2025-04-17
[40064] Singh, Raj: raj.singh@example.com
 - Blood glucose, consented 2025-04-17
 - Blood pressure, consented 2025-04-17
 - Heart Rate, consented 2025-04-17
[40065] Martinez, Sofia: sofia.martinez@example.com
 - Blood glucose, consented 2025-04-17
 - Blood pressure, consented 2025-04-17
 - Heart Rate, consented 2025-04-17
[40066] Kim, Jisoo: jisoo.kim@example.com
 - Blood glucose, consented 2025-04-17
 - Blood pressure, consented 2025-04-17
 - Heart Rate, consented 2025-04-17
[40067] Ivanov, Dmitri: dmitri.ivanov@example.com
 - Blood glucose, consented 2025-04-17
 - Blood pressure, consented 2025-04-17
 - Heart Rate, consented 2025-04-17
[40068] Mbatha, Sipho: sipho.mbatha@example.com
 - Blood glucose, consented 2025-04-17
 - Blood pressure, consented 2025-04-17
 - Heart Rate, consented 2025-04-17
[40069] Rossi, Giulia: giulia.rossi@example.com
 - Blood glucose, consented 2025-04-17
 - Blood pressure, consented 2025-04-17
 - Heart Rate, consented 2025-04-17
[40070] Hernandez, Luis: luis.hernandez@example.com
 - Blood glucose, consented 2025-04-17
 - Blood pressure, consented 2025-04-17
 - Heart Rate, consented 2025-04-17
[40071] Yilmaz, Aylin: aylin.yilmaz@example.com
 - Blood glucose, consented 2025-04-17
 - Blood pressure, consented 2025-04-17
 - Heart Rate, consented 2025-04-17
[40072] Andersson, Lars: lars.andersson@example.com
 - Blood glucose, consented 2025-04-17
 - Blood pressure, consented 2025-04-17
 - Heart Rate, consented 2025-04-17
A patient whose data has been requested, but has not consented (there will be no data on this patient):
jh_client.get_patient_consents(40001){'patient': {'id': 40001,
'jheUserId': 10007,
'identifier': 'demouser-min',
'nameFamily': 'Patient',
'nameGiven': 'Demo',
'birthDate': '1955-01-01',
'telecomPhone': None,
'telecomEmail': 'demouser@jupyterhealth.org',
'organizationId': 20013},
'consolidatedConsentedScopes': [],
'studiesPendingConsent': [{'id': 30011,
'name': 'Sample Data',
'description': 'To explore the Exchange capabilities. This study should only contain synthetic patients and already published or synthetic Observations.',
'organization': {'id': 20013,
'name': 'Example Institute for Tutorials',
'type': 'edu'},
'dataSources': [{'id': 70002,
'name': 'Dexcom',
'type': 'personal_device',
'supportedScopes': []},
{'id': 70001,
'name': 'iHealth',
'type': 'personal_device',
'supportedScopes': []}],
'pendingScopeConsents': [{'code': {'id': 50001,
'codingSystem': 'https://w3id.org/openmhealth',
'codingCode': 'omh:blood-glucose:4.0',
'text': 'Blood glucose'},
'consented': None,
'consentedTime': None},
{'code': {'id': 50002,
'codingSystem': 'https://w3id.org/openmhealth',
'codingCode': 'omh:blood-pressure:4.0',
'text': 'Blood pressure'},
'consented': None,
'consentedTime': None},
{'code': {'id': 50005,
'codingSystem': 'https://w3id.org/openmhealth',
'codingCode': 'omh:heart-rate:2.0',
'text': 'Heart Rate'},
'consented': None,
'consentedTime': None}]}],
'studies': []}A sample patient who has consented to share data with this study:
jh_client.get_patient_consents(40054){'patient': {'id': 40054,
'jheUserId': 10040,
'identifier': '1636-69-001',
'nameFamily': 'Nguyen',
'nameGiven': 'Minh',
'birthDate': '1984-07-11',
'telecomPhone': '265-642-0143',
'telecomEmail': 'minh.nguyen@example.com',
'organizationId': 20013},
'consolidatedConsentedScopes': [{'id': 50001,
'codingSystem': 'https://w3id.org/openmhealth',
'codingCode': 'omh:blood-glucose:4.0',
'text': 'Blood glucose'},
{'id': 50002,
'codingSystem': 'https://w3id.org/openmhealth',
'codingCode': 'omh:blood-pressure:4.0',
'text': 'Blood pressure'},
{'id': 50005,
'codingSystem': 'https://w3id.org/openmhealth',
'codingCode': 'omh:heart-rate:2.0',
'text': 'Heart Rate'}],
'studiesPendingConsent': [],
'studies': [{'id': 30011,
'name': 'Sample Data',
'description': 'To explore the Exchange capabilities. This study should only contain synthetic patients and already published or synthetic Observations.',
'organization': {'id': 20013,
'name': 'Example Institute for Tutorials',
'type': 'edu'},
'dataSources': [{'id': 70002,
'name': 'Dexcom',
'type': 'personal_device',
'supportedScopes': []},
{'id': 70001,
'name': 'iHealth',
'type': 'personal_device',
'supportedScopes': []}],
'scopeConsents': [{'code': {'id': 50001,
'codingSystem': 'https://w3id.org/openmhealth',
'codingCode': 'omh:blood-glucose:4.0',
'text': 'Blood glucose'},
'consented': True,
'consentedTime': '2025-04-17T16:45:45.625689Z'},
{'code': {'id': 50002,
'codingSystem': 'https://w3id.org/openmhealth',
'codingCode': 'omh:blood-pressure:4.0',
'text': 'Blood pressure'},
'consented': True,
'consentedTime': '2025-04-17T16:45:45.625689Z'},
{'code': {'id': 50005,
'codingSystem': 'https://w3id.org/openmhealth',
'codingCode': 'omh:heart-rate:2.0',
'text': 'Heart Rate'},
'consented': True,
'consentedTime': '2025-04-17T16:45:45.625689Z'}]}]}👩🏻🦰 Step 2: Select patient
Select the study patient you are interested in from the information above.
Now we can fetch observations into a pandas DataFrame for the data from this patient and this study.
# pick patient id from above
patient_id = 40072

df = jh_client.list_observations_df(patient_id=patient_id, study_id=study_id, limit=10_000, code=CGM)

dfWe can see a summary of the fields in an Observation if we look at just the first row
df.iloc[0]resource_type omh:blood-glucose:4.0
resourceType Observation
id 136676
meta_lastUpdated 2025-04-17 16:45:45.625689+00:00
status final
subject_reference Patient/40072
code_coding_0_code omh:blood-glucose:4.0
code_coding_0_system https://w3id.org/openmhealth
modality self-reported
schema_id_name blood-glucose
schema_id_version 3.1
schema_id_namespace omh
creation_date_time 2024-06-05 12:23:22+00:00
external_datasheets_0_datasheet_type manufacturer
external_datasheets_0_datasheet_reference Dexcom
source_creation_date_time 2024-06-05 12:23:22+00:00
blood_glucose_unit MGDL
blood_glucose_value 129
effective_time_frame_date_time 2024-06-05 12:23:22+00:00
temporal_relationship_to_meal unknown
creation_date_time_local 2024-06-05 12:23:22
source_creation_date_time_local 2024-06-05 12:23:22
effective_time_frame_date_time_local 2024-06-05 12:23:22
Name: 0, dtype: object🧠 Step 3: Calculate Glucose Metrics
These help us evaluate patient stability and risk zones.
We now compute key statistics to understand the glucose trends:
Mean Glucose
Glucose Variability (CV%)
Glucose Management Indicator (GMI)
Time in Range (%) =
Breakdown:
VLow = Level 2 Hypoglycemia (<54 mg/dL)
Low = Level 1 Hypoglycemia (54–69 mg/dL)
Target Range (70–180 mg/dL)
High = Level 1 Hyperglycemia (181–250 mg/dL)
VHigh = Level 2 Hyperglycemia (>250 mg/dL)
🧠 Glycemia Risk Index (GRI) GRI is a composite metric developed to summarize the overall glycemic risk based on CGM data. It combines both hypoglycemia and hyperglycemia exposure into a single score from 0 to 100, where:
0 = Ideal glycemic control (100% Time In Range)
100 = Maximum glycemic risk
The GRI is computed from the percentage of time spent in four glucose ranges:
📐 GRI Calculation
GRI is also visualized using a 2D GRI Grid, where:
X-axis = Hypoglycemia Component = VLow + (0.8 × Low)
Y-axis = Hyperglycemia Component = VHigh + (0.5 × High)
This allows clinicians to see whether risk is driven more by lows or highs, even if two patients have the same overall GRI.
The first block of code:
1.	✅ Confirms units are in mg/dL.
2.	🔍 Extracts just CGM glucose values and timestamps.
3.	🕐 Sorts the glucose values by time for downstream analysis.
# Reduce data to relevant subset for cgm
# make sure we're getting the units we expect
assert (df.blood_glucose_unit == 'MGDL').all()
# reduce data to interesting columns
cgm = df.loc[
:,
[
"blood_glucose_value",
"effective_time_frame_date_time_local",
],
]
# ensure sorted by date
cgm = cgm.sort_values("effective_time_frame_date_time_local")# Mean of glucose
mean_glucose = cgm["blood_glucose_value"].mean()
# Standard Deviation (SD) of glucose
std_glucose = cgm["blood_glucose_value"].std()
# Coefficient of Variation (CV) = (SD / Mean) * 100
cv_glucose = (std_glucose / mean_glucose) * 100
# Print results
print(f"Mean Glucose: {mean_glucose:.2f} mg/dL")
print(f"Standard Deviation (SD): {std_glucose:.2f} mg/dL")
print(f"Coefficient of Variation (CV): {cv_glucose:.2f}%")Mean Glucose: 103.92 mg/dL
Standard Deviation (SD): 23.71 mg/dL
Coefficient of Variation (CV): 22.82%
# Compute Glucose Management Indicator (GMI)
gmi = 3.31 + (0.02392 * mean_glucose)

# Print result
print(f"Glucose Management Indicator (GMI): {gmi:.2f}%")
Glucose Management Indicator (GMI): 5.80%
# --- GRI COMPONENTS ---

# Total CGM readings
total_readings = len(cgm)
#print(f"Total CGM Readings: {total_readings}")

# Define time-in-range categories
VLow = (cgm["blood_glucose_value"] < 54).sum() / total_readings * 100
Low = ((cgm["blood_glucose_value"] >= 54) & (cgm["blood_glucose_value"] < 70)).sum() / total_readings * 100
High = ((cgm["blood_glucose_value"] > 180) & (cgm["blood_glucose_value"] <= 250)).sum() / total_readings * 100
VHigh = (cgm["blood_glucose_value"] > 250).sum() / total_readings * 100

# Calculate GRI components
hypo_component = VLow + (0.8 * Low)
hyper_component = VHigh + (0.5 * High)
gri = (3.0 * hypo_component) + (1.6 * hyper_component)
gri = min(gri, 100)  # Cap GRI at 100

# Print results
print("\n--- GRI COMPONENTS ---")
print(f"Level 2 Hypoglycemia (<54 mg/dL): {VLow:.2f}%")
print(f"Level 1 Hypoglycemia (54-69 mg/dL): {Low:.2f}%")
print(f"Level 1 Hyperglycemia (181-250 mg/dL): {High:.2f}%")
print(f"Level 2 Hyperglycemia (>250 mg/dL): {VHigh:.2f}%")
print(f"Hypoglycemia Component: {hypo_component:.2f}%")
print(f"Hyperglycemia Component: {hyper_component:.2f}%")
print(f"Glycemia Risk Index (GRI): {gri:.2f}")
--- GRI COMPONENTS ---
Level 2 Hypoglycemia (<54 mg/dL): 0.15%
Level 1 Hypoglycemia (54-69 mg/dL): 4.07%
Level 1 Hyperglycemia (181-250 mg/dL): 0.70%
Level 2 Hyperglycemia (>250 mg/dL): 0.00%
Hypoglycemia Component: 3.41%
Hyperglycemia Component: 0.35%
Glycemia Risk Index (GRI): 10.78
📈 Step 4: Visualize Glucose Patterns
This section generates:
GRI Grid
Daily Glucose Profiles
Ambulatory Glucose Profile (AGP)
Goals for Type 1 and Type Diabetes
These are vital for interpreting glycemic control and variability.
🟩 Median Glucose Trend Line
The green line represents a smoothed median glucose trend for each day. It is calculated using a rolling window of 5 readings, which helps reduce short-term fluctuations and highlight overall trends in glucose levels.
✅ Helps visualize daytime and nighttime patterns
✅ Reduces noise from rapid sensor changes
⚠️ May slightly lag or flatten sharp spikes or drops
This smoothing approach mimics how continuous glucose monitoring (CGM) systems often display data to enhance clinical interpretation.
# GRI GRID

import matplotlib.pyplot as plt
import numpy as np
from matplotlib.colors import ListedColormap
from matplotlib.patches import Patch

# Define the plotting area
fig, ax = plt.subplots(figsize=(8, 6))

# Create a meshgrid for the background
x = np.linspace(0, 40, 400)
y = np.linspace(0, 60, 400)
X, Y = np.meshgrid(x, y)

# Define risk zones: diagonal bands (Zone A to E)
zone = np.zeros_like(X)
zone_bounds = [(0, 20), (20, 40), (40, 60), (60, 80), (80, 100)]

for i, (low, high) in enumerate(zone_bounds):
    mask = (3.0 * X + 1.6 * Y >= low) & (3.0 * X + 1.6 * Y < high)
    zone[mask] = i + 1

# Define zone colors (Zone A to E: green to red)
zone_colors = ['#d2fbd4', '#f0fcb2', '#fff4a3', '#ffd0a1', '#ff9d9d']
zone_labels = ['Zone A', 'Zone B', 'Zone C', 'Zone D', 'Zone E']
zone_cmap = ListedColormap(zone_colors)

# Show background zones
ax.contourf(X, Y, zone, levels=[0.5,1.5,2.5,3.5,4.5,5.5], colors=zone_colors, alpha=0.5)

# Plot GRI point (replace with your values)
hypo_component
hyper_component
gri

ax.scatter(hypo_component, hyper_component, color='black', s=120, edgecolors='white', zorder=10)
ax.text(hypo_component + 0.5, hyper_component, f"GRI = {gri:.1f}", fontsize=10)

# Labels and formatting
ax.set_xlabel("Hypoglycemia Component (%)")
ax.set_ylabel("Hyperglycemia Component (%)")
ax.set_title("GRI Grid with Color-Zoned Risk Levels")
ax.set_xlim(0, 40)
ax.set_ylim(0, 60)
ax.grid(True)

# Create a legend for the zones
legend_patches = [Patch(color=zone_colors[i], label=zone_labels[i]) for i in range(len(zone_labels))]
ax.legend(handles=legend_patches, title="GRI Zones", loc="upper right", frameon=True)

plt.show()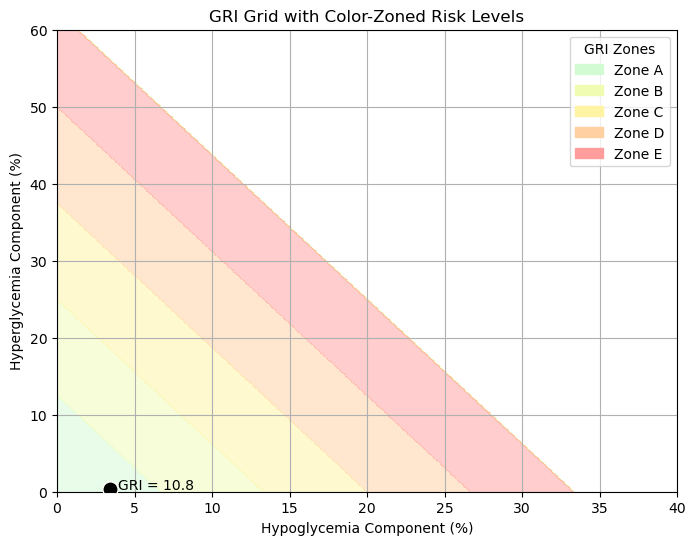
# CGM and AGP Visualization

# 1. Imports
import datetime

import matplotlib.pyplot as plt
import pandas as pd

# 2. Enums and Utility Mappings


class Category(Enum):
    very_low = "Very Low"
    low = "Low"
    target_range = "Target Range"
    high = "High"
    very_high = "Very High"


category_colors = {
    Category.very_low.value: "#a00",
    Category.low.value: "#f44",
    Category.target_range.value: "#CDECCD",
    Category.high.value: "#FDBE85",
    Category.very_high.value: "#FD8D3C",
}

# 3. Data Preparation
cgm_plot = cgm.copy()
cgm_plot["effective_time_frame_date_time_local"] = pd.to_datetime(
    cgm_plot["effective_time_frame_date_time_local"]
)
cgm_plot["date"] = cgm_plot["effective_time_frame_date_time_local"].dt.date.astype(str)
cgm_plot["hour"] = (
    cgm_plot["effective_time_frame_date_time_local"].dt.hour +
    cgm_plot["effective_time_frame_date_time_local"].dt.minute / 60
)

# 4. Classification Function


def classify_glucose(row):
    if row.blood_glucose_value < 54:
        return Category.very_low.value
    elif row.blood_glucose_value < 70:
        return Category.low.value
    elif row.blood_glucose_value < 180:
        return Category.target_range.value
    elif row.blood_glucose_value < 250:
        return Category.high.value
    else:
        return Category.very_high.value


cgm_plot["category"] = cgm_plot.apply(classify_glucose, axis=1)

# 5. Helper to Add Background Zones


def add_glucose_zones(ax):
    ax.axhspan(0, 54, facecolor="#a00", alpha=0.1)
    ax.axhspan(54, 70, facecolor="#f44", alpha=0.1)
    ax.axhspan(70, 180, facecolor="#CDECCD", alpha=0.3)
    ax.axhspan(180, 250, facecolor="#FDBE85", alpha=0.2)
    ax.axhspan(250, 400, facecolor="#FD8D3C", alpha=0.2)
# 6. Daily Subplots
cols = 5
dates = sorted(cgm_plot["date"].unique())[:10]
rows = (len(dates) + cols - 1) // cols
fig, axes = plt.subplots(rows, cols, figsize=(cols * 5, rows * 3), sharey=True)
axes = axes.flatten()
grouped = cgm_plot.groupby("date")
for i, date in enumerate(dates):
ax = axes[i]
day_data = grouped.get_group(date).sort_values("hour")
add_glucose_zones(ax)
smoothed = day_data["blood_glucose_value"].rolling(window=5, center=True, min_periods=1).median()
ax.plot(day_data["hour"], smoothed, color="green", label="Median Glucose")
# Fill high
ax.fill_between(
day_data["hour"], 180, day_data["blood_glucose_value"],
where=day_data["blood_glucose_value"] > 180,
color="#FDAE61", alpha=0.5
)
# Plot low
low_mask = day_data["blood_glucose_value"] < 70
ax.plot(
day_data["hour"][low_mask],
day_data["blood_glucose_value"][low_mask],
color="#E41A1C", linewidth=1.5
)
weekday = datetime.datetime.strptime(date, "%Y-%m-%d").strftime("%A")
ax.set_xlim(0, 24)
ax.set_xticks([12])
ax.set_xticklabels(["12 PM"])
ax.set_ylim(0, 300)
ax.set_yticks([54,70, 180, 250, 300])
ax.set_yticklabels(["", "70", "180", "250", "300"])
ax.set_title(f"{weekday}\n{date}")
ax.axvline(x=12, color="gray", linestyle="--", linewidth=1, alpha=0.6)
ax.grid(True)
if i == 0:
ax.legend(fontsize=8, loc="upper right", frameon=False)
for j in range(i + 1, len(axes)):
axes[j].axis("off")
fig.suptitle("Daily CGM Profiles with Glucose Zones", fontsize=16, y=0.94)
plt.tight_layout()
plt.subplots_adjust(
top=0.75, # space for the title
hspace=0.75, # vertical space between rows (lower = tighter)
wspace=0 # horizontal space between columns (try 0 for near-touching)
)
plt.show()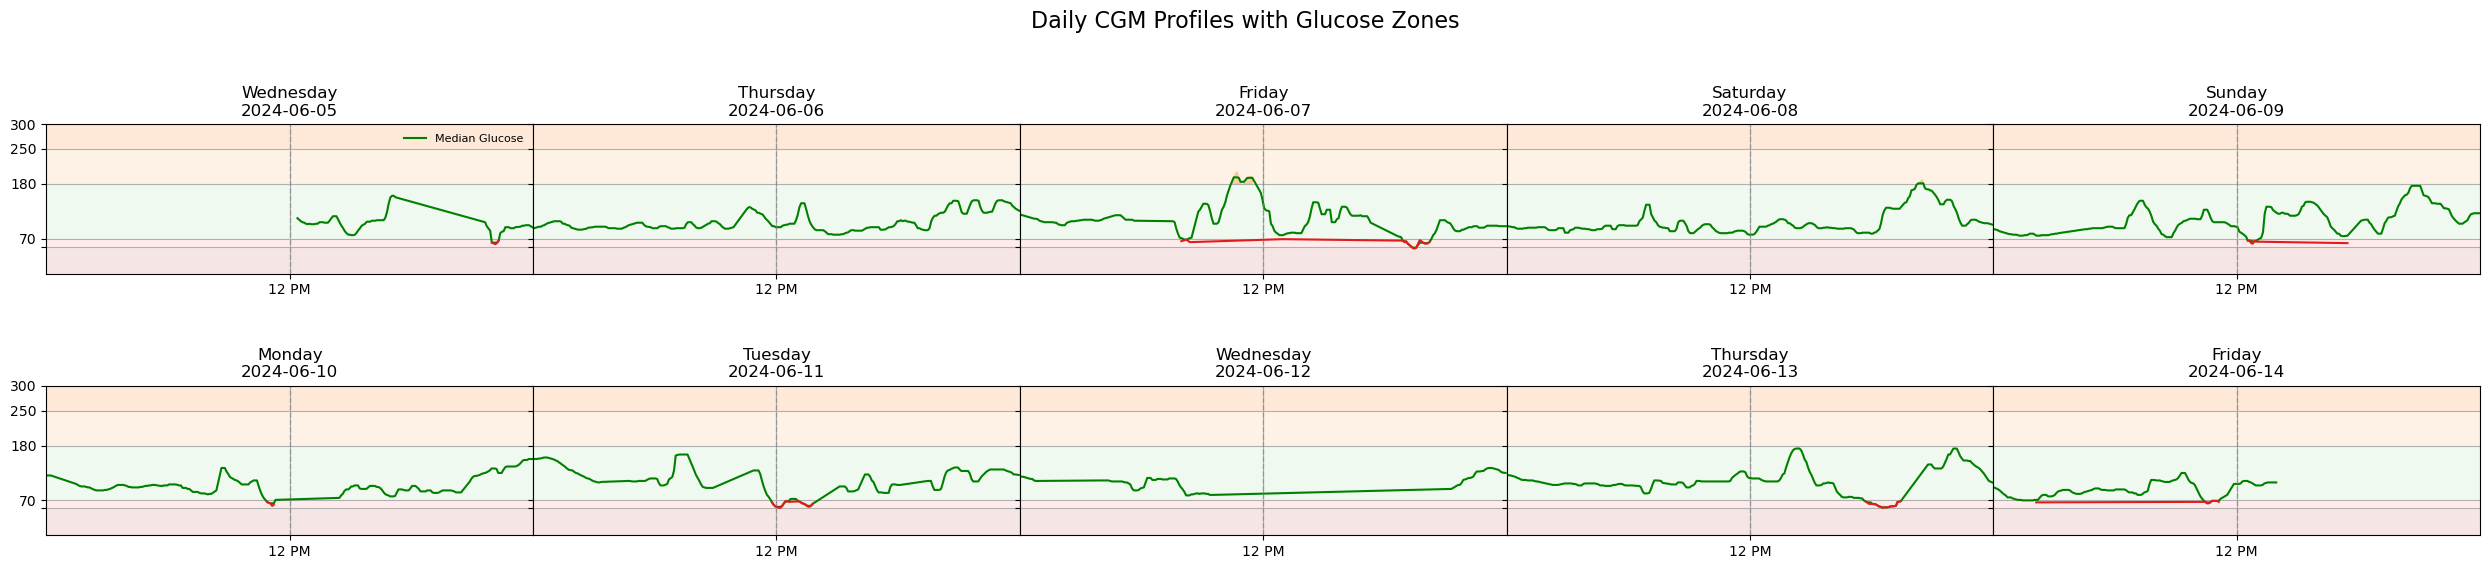
Ambulatory Glucose Profile (AGP) visualizes glucose trends as if they occurred in a single day. Colored Bands (Percentile Ranges):
Dark Green Line: Median glucose (50th percentile).
Green Shaded Area: 25th–75th percentile range.
Orange Shaded Area: 5th–95th percentile range.
Target Range (70–180 mg/dL):
Marked in green with horizontal lines at 70 mg/dL and 180 mg/dL.
# 7. AGP (Ambulatory Glucose Profile)
cgm_plot["minute_of_day"] = (
    cgm_plot["effective_time_frame_date_time_local"].dt.hour * 60 +
    cgm_plot["effective_time_frame_date_time_local"].dt.minute
)
cgm_plot["time_bin"] = (cgm_plot["minute_of_day"] // 5) * 5

agp_summary = cgm_plot.groupby("time_bin")["blood_glucose_value"].quantile([0.05, 0.25, 0.5, 0.75, 0.95]).unstack()
agp_summary.columns = ["p5", "p25", "p50", "p75", "p95"]
agp_summary = agp_summary.reset_index()
agp_summary["hour"] = agp_summary["time_bin"] / 60

plt.figure(figsize=(12, 6))
add_glucose_zones(plt)
plt.fill_between(agp_summary["hour"], agp_summary["p5"], agp_summary["p95"], color="#D8E3E7", alpha=0.5, label="5–95% Range")
plt.fill_between(agp_summary["hour"], agp_summary["p25"], agp_summary["p75"], color="#B0C4DE", alpha=0.6, label="25–75% Range")
plt.plot(agp_summary["hour"], agp_summary["p50"], color="green", linewidth=2, label="Median")

plt.title("Ambulatory Glucose Profile (AGP)")
plt.xlabel("Time of Day")
plt.ylabel("Glucose (mg/dL)")
plt.xticks([0, 6, 12, 18, 24], ["12 AM", "6 AM", "12 PM", "6 PM", "12 AM"])
plt.xlim(0, 24)
plt.ylim(0, 300)
plt.yticks([54, 70, 180, 250, 300])
plt.grid(True)
plt.legend(loc="upper right", fontsize=10, frameon=True, framealpha=0.9)
plt.tight_layout()
plt.show()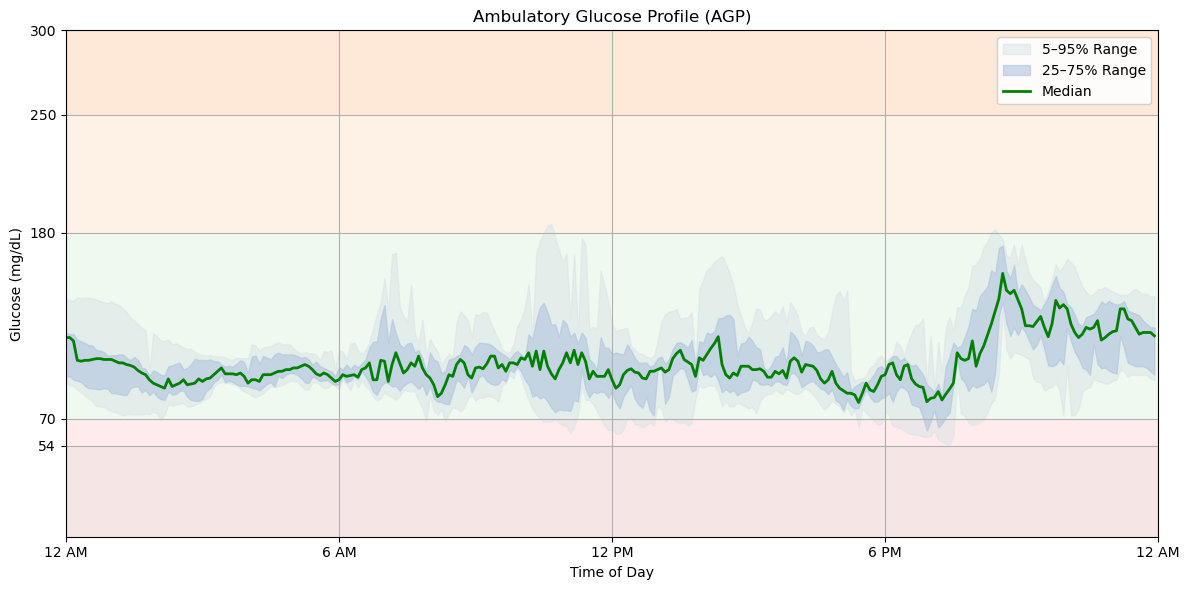
# Count total readings
total = len(cgm_plot)

# Compute % time in each range
tir_data = {
    "Very Low (<54)": (cgm_plot["blood_glucose_value"] < 54).sum() / total * 100,
    "Low (54–69)": ((cgm_plot["blood_glucose_value"] >= 54) & (cgm_plot["blood_glucose_value"] < 70)).sum() / total * 100,
    "Target (70–180)": ((cgm_plot["blood_glucose_value"] >= 70) & (cgm_plot["blood_glucose_value"] <= 180)).sum() / total * 100,
    "High (181–250)": ((cgm_plot["blood_glucose_value"] > 180) & (cgm_plot["blood_glucose_value"] <= 250)).sum() / total * 100,
    "Very High (>250)": (cgm_plot["blood_glucose_value"] > 250).sum() / total * 100,
}

# Plot
plt.figure(figsize=(8, 5))
tir_colors = [
    "#a00", "#f44", "#CDECCD", "#FDBE85", "#FD8D3C"
]
bars = plt.barh(list(tir_data.keys()), list(tir_data.values()), color=tir_colors)

plt.xlabel("Time in Range (%)")
plt.title("Time in Glucose Ranges")
plt.xlim(0, 100)
plt.grid(axis="x", linestyle="--", alpha=0.5)

# Add percentage labels
for bar in bars:
    width = bar.get_width()
    plt.text(width + 1, bar.get_y() + bar.get_height()/2,
             f"{width:.1f}%", va='center', fontsize=9)

plt.tight_layout()
plt.show()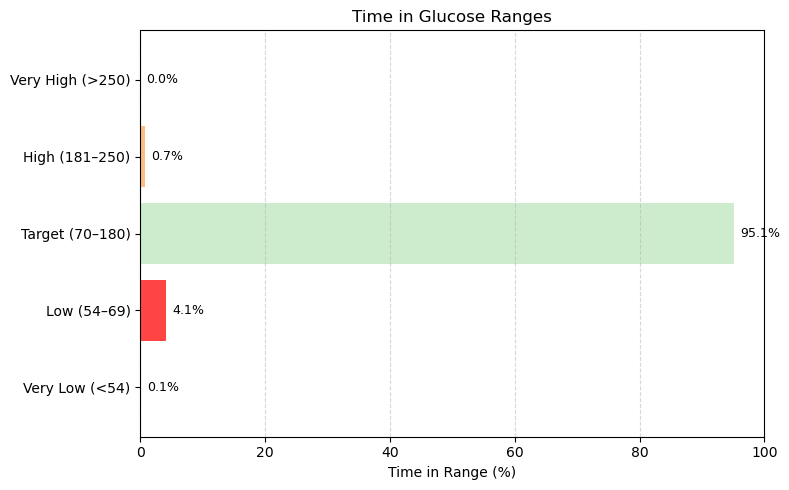
# Define the same time-in-range calculation
tir_data = {
    "Very Low": (cgm_plot["blood_glucose_value"] < 54).sum(),
    "Low": ((cgm_plot["blood_glucose_value"] >= 54) & (cgm_plot["blood_glucose_value"] < 70)).sum(),
    "Target": ((cgm_plot["blood_glucose_value"] >= 70) & (cgm_plot["blood_glucose_value"] <= 180)).sum(),
    "High": ((cgm_plot["blood_glucose_value"] > 180) & (cgm_plot["blood_glucose_value"] <= 250)).sum(),
    "Very High": (cgm_plot["blood_glucose_value"] > 250).sum(),
}

total = sum(tir_data.values())
tir_pct = {k: v / total * 100 for k, v in tir_data.items()}

# Colors that match your other plots
tir_colors = {
    "Very Low": "#a00",
    "Low": "#f44",
    "Target": "#CDECCD",
    "High": "#FDBE85",
    "Very High": "#FD8D3C",
}

# Plot the vertical stacked bar
plt.figure(figsize=(2, 6))

bottom = 0
for label in ["Very Low", "Low", "Target", "High", "Very High"]:
    height = tir_pct[label]
    plt.bar(0, height, bottom=bottom, color=tir_colors[label], width=0.5, edgecolor='white')
    # Add percent labels
    if height > 3:  # skip labeling tiny slivers
        plt.text(0.6, bottom + height / 2, f"{height:.0f}%", va='center', fontsize=9)
    bottom += height

# Formatting
plt.xlim(-0.5, 2)
plt.ylim(0, 100)
plt.xticks([])
plt.ylabel("Time in Range (%)")
plt.title("Glucose Zones")

# Optional: add reference lines
for y in [70, 180, 250]:  # these are just visual references, can be removed
    plt.axhline(y=y, color='gray', linestyle='--', linewidth=0.5, alpha=0.3)

plt.box(False)
plt.tight_layout()
plt.show()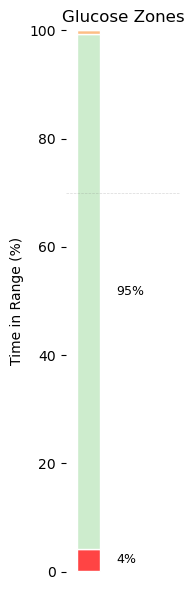
df['Time'] = df.effective_time_frame_date_time_local
df['Glucose'] = df.blood_glucose_value
df['Day'] = df['Time'].dt.date
cgmquantify.plotglucosebounds(df)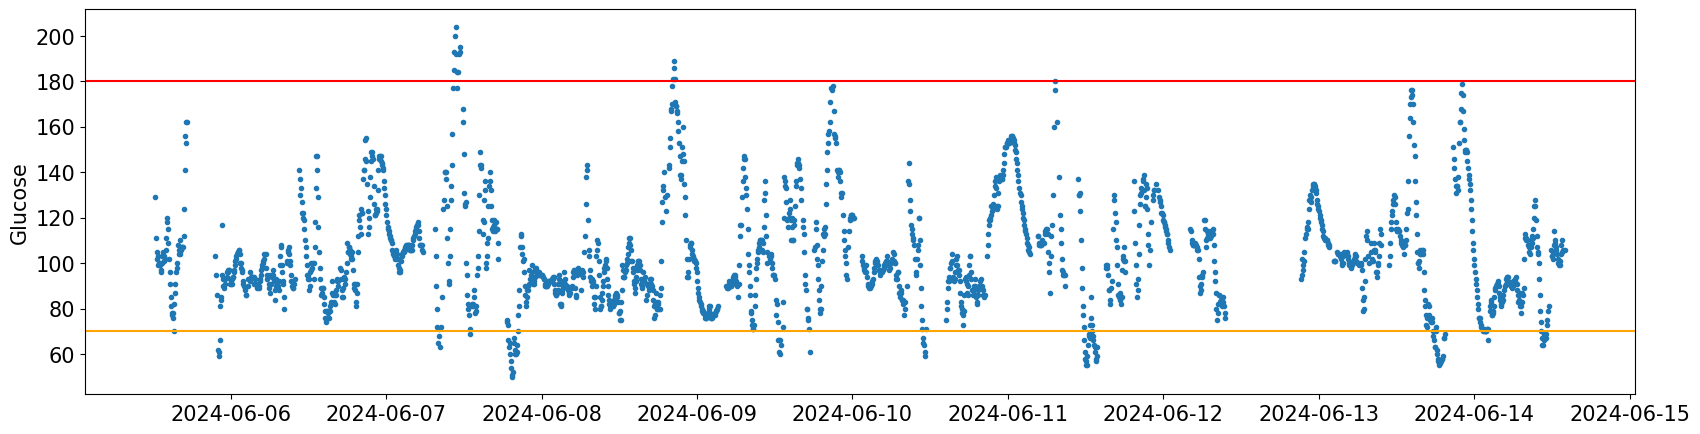
cgm.head()MAGE (Mean Amplitude of Glycemic Excursions)
MAGE measures large glucose fluctuations:
# Calculate differences between consecutive glucose values
cgm["glucose_diff"] = cgm["blood_glucose_value"].diff().abs()

# Define a threshold for significant glucose excursions (e.g., 1 SD)
threshold = std_glucose

# Compute MAGE: Mean of all large excursions above the threshold
mage = cgm[cgm["glucose_diff"] > threshold]["glucose_diff"].mean()
print(f"Mean Amplitude of Glycemic Excursions (MAGE): {mage:.2f} mg/dL")
Mean Amplitude of Glycemic Excursions (MAGE): 37.74 mg/dL
MODD (Mean of Daily Differences)
MODD measures day-to-day glucose fluctuations at the same time of day:
# Extract hour and minute from the timestamp
cgm["time_of_day"] = cgm["effective_time_frame_date_time_local"].dt.strftime("%H:%M")

# Compute the mean glucose value for each time of day across all days
mean_per_time = cgm.groupby("time_of_day")["blood_glucose_value"].mean()

# Compute MODD as the mean of absolute day-to-day differences
modd = mean_per_time.diff().abs().mean()
print(f"Mean of Daily Differences (MODD): {modd:.2f} mg/dL")
Mean of Daily Differences (MODD): 14.53 mg/dL
Step 5: 📊 Aggregate study data across patients
If we omit the patient_id from the query, we will get observations for all patients in the study.
The patient is identified by the subject_reference column, which looks like Patient/{patient_id}
all_study_data = jh_client.list_observations_df(study_id=study_id, limit=50_000, code=CGM)
all_study_dataWe can remove the Patient/ prefix in subject_reference, and subset the relevant data as we did before.
This time, keeping patient_id so we can differentiate patients.
all_study_data["patient_id"] = all_study_data["subject_reference"].str.replace("Patient/", "")

all_cgm = all_study_data.loc[
    :,
    [
        "patient_id",
        "blood_glucose_value",
        "effective_time_frame_date_time_local",
    ],
]
# ensure sorted by date
all_cgm = all_cgm.sort_values("effective_time_frame_date_time_local")
all_cgm.head()Now we can group by patient to compare across our cohort:
all_cgm.groupby("patient_id").blood_glucose_value.mean().sort_values().plot(kind="bar");
plt.title("Mean blood glucose")
plt.ylabel("mg/dL");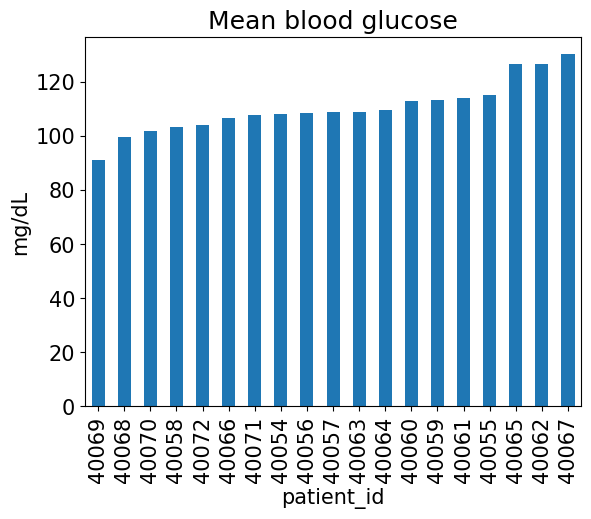
And again, compute our Glucose Management Indicator (GMI) from the mean:
def compute_gmi(mean_glucose):
    return 3.31 + (0.02392 * mean_glucose)

all_cgm.groupby("patient_id").blood_glucose_value.mean().apply(compute_gmi).sort_values().plot(kind="bar")
plt.title("Glucose Management Indicator (GMI)");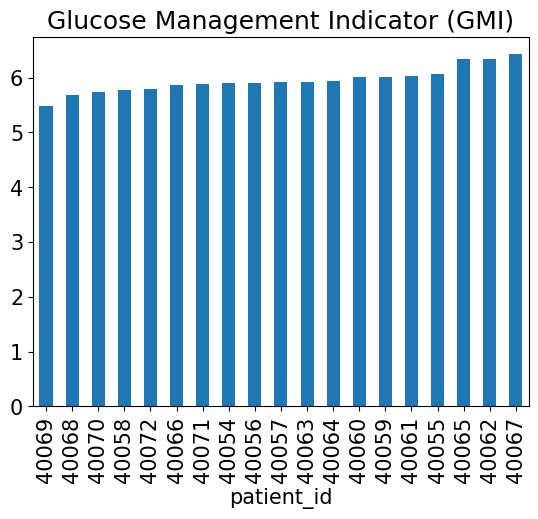
We can also use this information to produce time-in-range bar for every patient in the study
def compute_time_in_range(df):
    tir_data = {
        "Very Low": (df["blood_glucose_value"] < 54).sum(),
        "Low": ((df["blood_glucose_value"] >= 54) & (df["blood_glucose_value"] < 70)).sum(),
        "Target": ((df["blood_glucose_value"] >= 70) & (df["blood_glucose_value"] <= 180)).sum(),
        "High": ((df["blood_glucose_value"] > 180) & (df["blood_glucose_value"] <= 250)).sum(),
        "Very High": (df["blood_glucose_value"] > 250).sum(),
    }
    return pd.Series(tir_data) * 100 / len(df)

ranges = all_cgm.groupby("patient_id").apply(compute_time_in_range, include_groups=False)
rangesranges.plot(kind='bar', stacked=True, color=tir_colors)
plt.legend(bbox_to_anchor=(1, 1), reverse=True)
plt.ylim(0, 100)
plt.title("% time in range");Data Sources and Methodology:
This tutorial uses sample CGM data from the PLOS Biology supplemental dataset: cite (no label)
Analysis methods are based on:
Hall, H., et al. (2018). Glucotypes reveal new patterns of glucose dysregulation. PLOS Biology. Hall et al. (2018)
Glycemia Risk Index methodology: https://
www .diabetestechnology .org /gri/
- Hall, H., Perelman, D., Breschi, A., Limcaoco, P., Kellogg, R., McLaughlin, T., & Snyder, M. (2018). Glucotypes reveal new patterns of glucose dysregulation. PLOS Biology, 16(7), e2005143. 10.1371/journal.pbio.2005143